Excel Essentials Every Data Analyst Must Master

Excel remains one of the most powerful tools in a data analyst’s toolkit.
Despite the rise of tools like Python, SQL, and Power BI, Excel continues to dominate the early stages of data analysis because it is accessible, flexible, and extremely powerful when used correctly.
From cleaning messy datasets to creating insightful dashboards, Excel allows analysts to transform raw data into meaningful insights.
If you're starting your journey in data analytics, mastering Excel is a must.
1. Data Cleaning and Preparation
Before analyzing data, analysts must clean and organize it.
Real-world data is rarely perfect. It often contains:
Missing values
Duplicate records
Formatting inconsistencies
Extra spaces or special characters
Excel provides several tools to fix these issues quickly.
Important Data Cleaning Tools
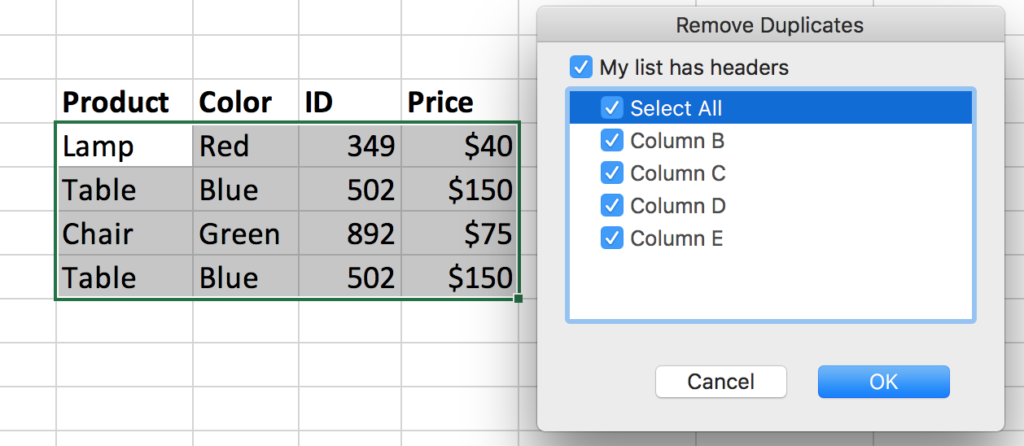
Remove Duplicates
Text to Columns
Find & Replace
TRIM()
CLEAN()
Example:
=TRIM(A2)
This removes extra spaces from text.
Clean data ensures accurate analysis and reliable results.
2. Essential Excel Formula
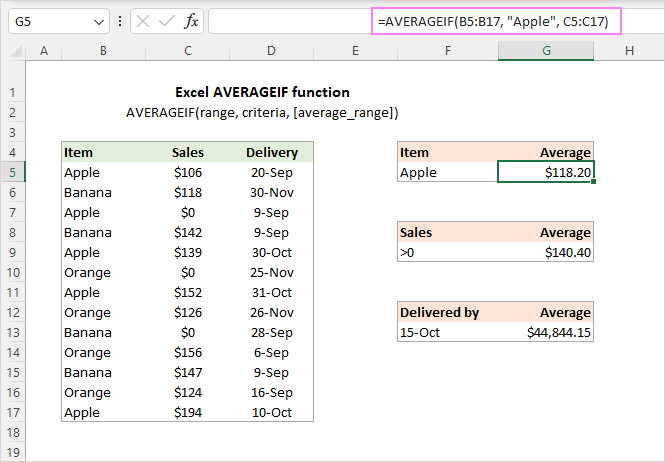
Formulas are the core of Excel analysis.
Data analysts rely on formulas to calculate metrics, manipulate data, and perform logical operations.
Must-Know Excel Functions
| Function | Purpose |
|---|---|
| SUM | Adds numbers |
| AVERAGE | Calculates average |
| COUNT | Counts cells |
| IF | Conditional logic |
| VLOOKUP | Lookup values |
| INDEX + MATCH | Advanced lookup |
Example:
=IF(B2>5000,"High Sales","Low Sales")
This categorizes sales based on value.
Mastering formulas helps analysts automate repetitive calculations.
3. Pivot Tables for Data Analysis
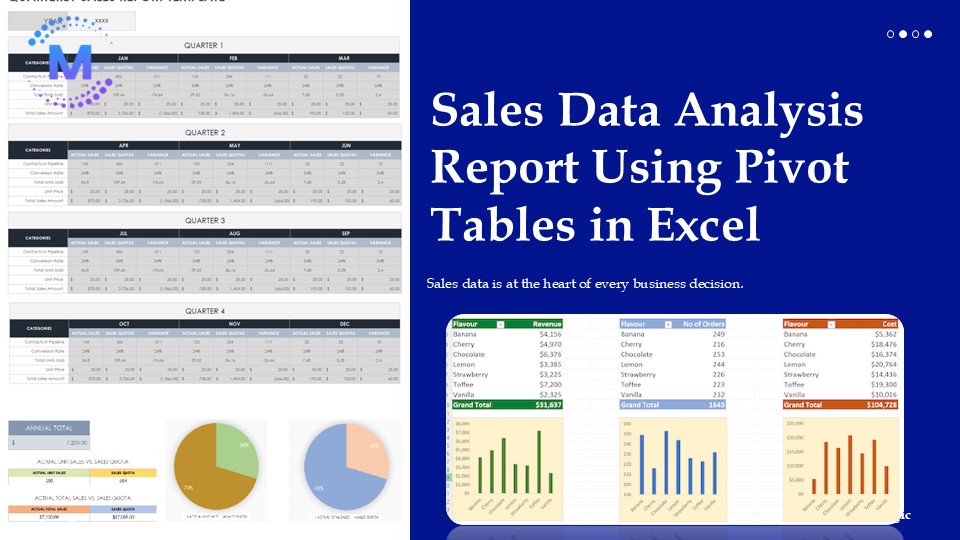
Pivot Tables are one of the most powerful features in Excel.
They allow analysts to summarize large datasets instantly without writing complex formulas.
With pivot tables you can:
Aggregate data
Compare categories
Calculate totals and averages
Analyze trends
Example insights you can generate:
Total sales by region
Monthly revenue trends
Product category performance
Pivot tables transform raw data into meaningful summaries within seconds.
4. Data Visualization with Charts

Data analysts must present insights in a clear and visual format.
Excel includes many chart types:
Bar charts
Line charts
Pie charts
Scatter plots
Combo charts
Visualizations help stakeholders quickly understand:
Patterns
Trends
Comparisons
Outliers
A well-designed chart often communicates insights faster than tables or reports.
5. Conditional Formatting
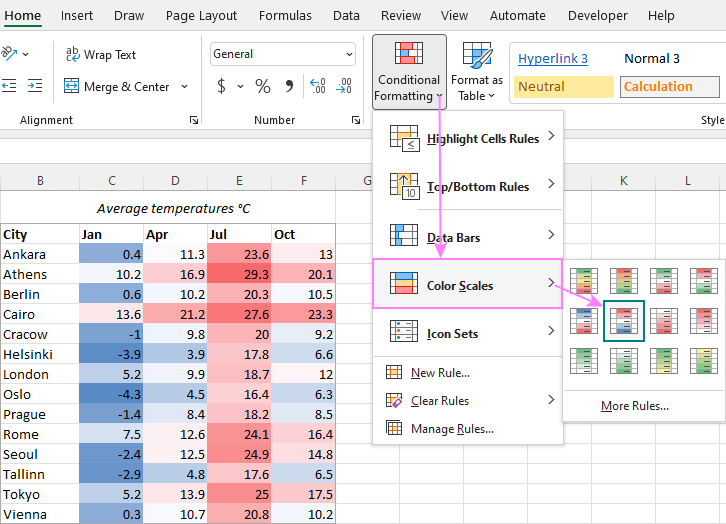
Conditional formatting helps analysts highlight important patterns in data automatically.
For example, you can:
Highlight top sales values
Show heatmaps
Identify duplicates
Flag negative values
Example:
Highlight sales greater than 10,000 using a rule.
This helps analysts quickly identify critical insights or anomalies.
6. Data Filtering and Sorting

When working with large datasets, filtering becomes essential.
Excel allows analysts to:
Filter specific categories
Sort ascending or descending
Apply advanced filters
Focus on relevant data segments
For example:
Filter a dataset to show only sales from a specific region.
This helps analysts analyze subsets of data efficiently.
7. Excel Dashboards

Dashboards combine multiple charts and tables to present key metrics in one place.
A typical Excel dashboard includes:
KPI metrics
Charts
Pivot tables
Slicers for filtering
Dashboards allow stakeholders to monitor performance and make decisions quickly.
They are widely used in:
Business analytics
Marketing reports
Financial analysis
Sales tracking
8. Automation with Excel Shortcuts and Macros
Data analysts often work with repetitive tasks.
Excel automation tools help save time.
Important automation methods
Keyboard Shortcuts
Examples:
Ctrl + Shift + L→ Apply filtersCtrl + T→ Create tableAlt + =→ AutoSum
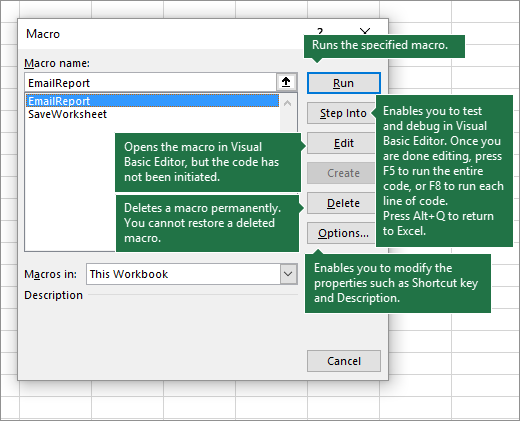
Macros (VBA)
Macros allow analysts to automate complex workflows.
Example tasks you can automate:
Data formatting
Report generation
Data cleaning steps
Automation helps analysts focus more on insights rather than manual work.
Excel remains a foundational skill for every data analyst.
Mastering Excel allows analysts to:
Clean messy datasets
Perform calculations efficiently
Analyze trends quickly
Create insightful visualizations
Build professional dashboards
Even in the era of Python and AI, Excel continues to be an essential tool for data-driven decision making.
If you're serious about becoming a data analyst, mastering Excel is one of the smartest investments you can make.


